There are many statistics available to evaluate player quality. From Wins Above Replacement, to Expected Goal Differentials to Corsi, these statistics focus on determining how much a player is worth to a team and evaluating the level at which they contribute. However, there do not appear to be statistics measuring how these players contribute. This research attempts to use a clustering algorithm to see what archetypes of players exist and how their different playing styles lead to differing contributions to their hockey team.
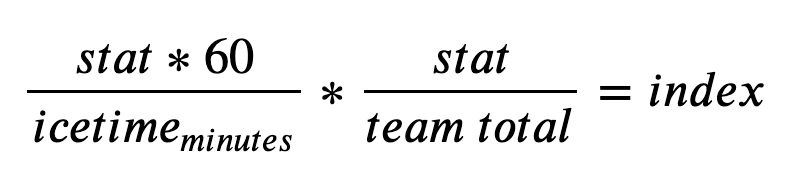
The work in this post is an adaptation of Ryan Stimson’s work in 2017. Using his dataset from The Passing Project, he was able to come up with 4 archetypes for forwards and 3 archetypes for defensemen. Unfortunately, the dataset he used does not seem to be easily available anywhere at the time of this writing in February 2023. Therefore, this work uses Moneypuck’s dataset and focuses on the last full season: 2021-2022. The approach is similar to Stimson’s: raw even-strength statistics are divided by ice time to get each players contribution per 60 minutes. This number is then multiplied by the percentage of the team statistic the player contributed to, allowing all player’s playing style to be evaluated regardless of quality and team playing style (i.e coaches that focus on defense vs offense). This process creates an index for each statistic that can be used in the clustering algorithm.
While Stimson generated many indices including shot passes, breakout passes, etc., the most effective clustering with the Moneypuck dataset was found using shots, goals, and assists. However, since goals and assists occur at a much lower frequency than passes, these results will differ slightly than Stimson’s. This would be worthwhile to recreate with a passing dataset if something becomes available, as passes and shot assists are more repeatable than goals and assists, and will lead to a better classification within the clusters. Nevertheless, the approach with the available data discussed did provide some interesting insights.
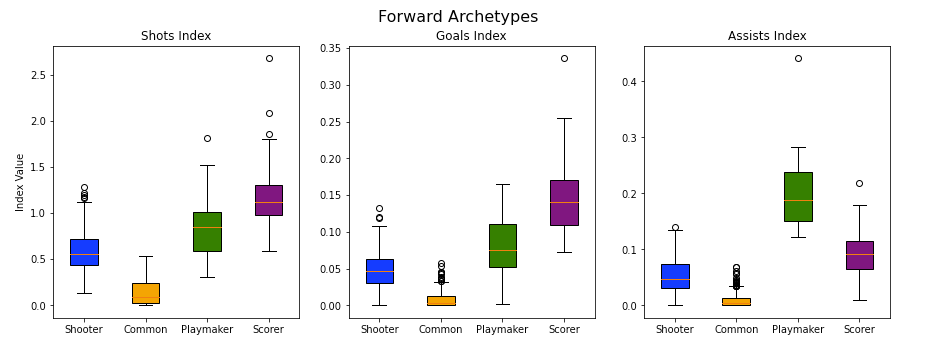
Stimson’s approach of 4 clusters for forwards and 3 clusters for defensemen was found to be the best configuration with the new indices as well. Of the 4 forward types, the one that stands out the most is the one with the high assist index. These are players that generate assists at a higher rate than their peers and has been named the “Playmaker” . Examples include Connor McDavid, Sidney Crosby and Mitch Marner. There is also a type that has a much higher goals index than the others, along with the highest shots index. Therefore, this type will be named the “Scorer”, and includes players like Auston Matthews, Alex Ovechkin and Timo Meier. Of the remaining two types, there is one with a significantly higher shots index than the other. The one with the higher shots index also includes a higher goals and assists index. Therefore this type will be named the “Shooter” and the remaining type will be the “Common” type. “Common” is the biggest group with players like Tyler Bozak and Nick Foligno. Examples of Shooters are Claude Giroux, Bo Horvat and Jamie Benn.
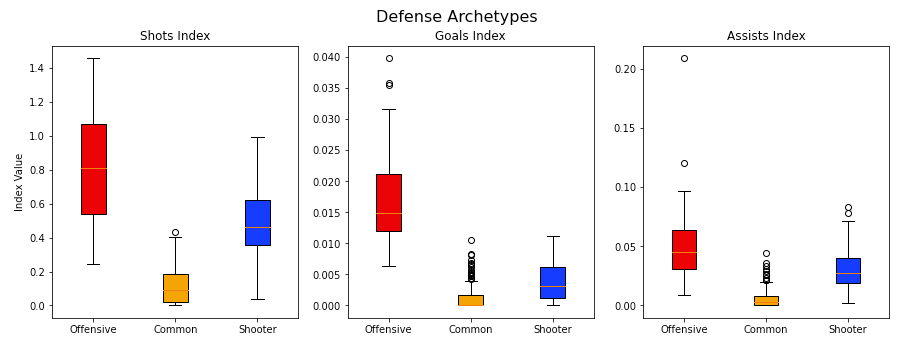
Similarly for the defensemen, there are players that have higher indices across the board. These will be named as “Offensive” types and include players like Victor Hedman and Roman Josi. Of the remaining two types there is one that has significantly higher shots index. This will be named a “Shooter” type, with examples such as Miro Heiskanan and Alex Pietrangelo. The final type will be “Common” and include players like Jack Johnson and Victor Mete.
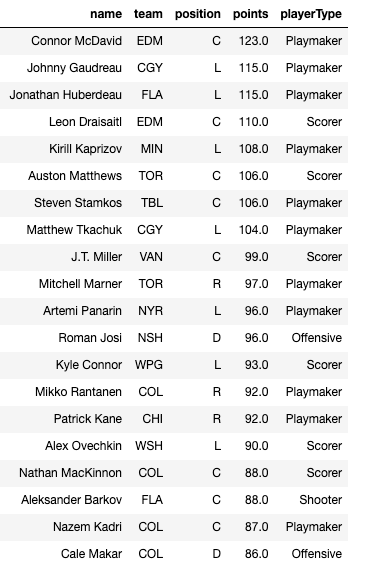
As a final sanity check and inspection, the top 20 point getters from the 2021-2022 season and their player types are listed below.
The clustering has brought insights into how these players contribute to their teams. The lack of Common players, which do not have standout shot, goals or assists index shows that they do not contribute on the scoresheet (likely some other index would be needed to see their contributions). Furthermore, it can be seen which players contribute more on scoring versus playmaking. This classification can be used as another tool for evaluating player fit for rosters and really looking into how a player contributes to a team.
